


Continuous Monitoring Using ELK on Ubuntu
Installation of Elasticsearch, Kibana, Logstash and Beats


What is ELK or ELASTIC STACK?
Elastic Stack (ELK) refers to a set of open-source products developed by elastic to help its users collect data from different types of sources, analyze the collected data, and represent the analysis in an easy-to-understand and aesthetic visualization so that meaningful observations can be made.
Features of ELK:
- System performance monitoring
- Log Management
- Application Performance Monitoring
- Application Data Analysis
- Security Monitoring Alerting
- Data Visualization

learning how to use all components of ELASTIC STACK takes some time, but the payoff is great and grants a deeper understanding of the software's underlying structure.
What are the components of ELK?
There are four Components of ELKS, they are:
- Elasticsearch : For storing and searching the collected data
- Logstash : For collecting and filtering the input data
- kibana : provides a graphical user interface
- Beats : Offers multiple light-weight data collectors
ELasticsearch:
Elasticsearch is a NoSQL database that was developed based on Apache Lucene search engine. it can be used to index and store different types of documents and data. it provides a function to search for the data that is stored in real-time as its being fed.
Logstash:
Logstash is a collection agent used to collect both heterogenous, non-heterogenous data from various sources. it has the capability to screen, breakdown, and make string alterations in the data it collects. After collecting and filtering the data, it then sends it to Elasticsearch for storage.
Kibana:
Kibana is a graphical user interface used to display the data that is collected and stored in Elasticsearch. It displays the data with appealing visuals so that the data could be easily understood and analyzed; it does so by using multiple types of visuals like bar chart, pie chart, world map, heat map, co-ordinate map, etc.
Features of Kibana:
-Discover your data by exploring it
-Analyze your data by applying different metrics
-Visualize the data by creating different types of charts
-Apply Machine Learning on the data to get data anomaly
-Manage users and roles
-Offer a console to run Elasticsearch expressions
-Play with time-series data using Timeline
-Monitor your Elastic Stack using monitoring
Beats:
Beats is similar to Logstash in the fact that they both collect data that will be later stored and analyzed, but Beats differs in the method of collection. Beats is a set of multiple small software installed on different servers from where they collect the data and send it to Elasticsearch.
ELKB flow:

First, Beats are attached to remote servers from where these Beats collect information from various sources.
After collecting all the data needed, they either ship the data to Logstash for filtration or directly send it to Elasticsearch.
The data is then stored in Elasticsearch. From here, it will not be directly sent to Kibana. Kibana first needs to find where Elastic is and then go and get the data by itself.

Features od ELK :
1. System Performance Monitoring
2. Log Management
3. Applicatioon Performance Monitoring
4. Application Data Analysis
5. Security Monitoring and
6. Alerting Data Visualisation
ELK Installation :
Pre-requisites:-
-> Atleast 2GB of RAM
-> Atleast 20GB storage
-> JAVA
-> We need to use ubuntu ami of t2-medium
Installing JAVA on the aws amazon-linux instance & other commands as a pre-requisites|:sudo apt updatesudo apt install openjdk-8-jdk -ysudo apt-get install -y nginxsudo systemctl start nginx
Install Elasticsearch:
wget https://artifacts.elastic.co/downloads/elasticsearch/elasticsearch-7.2.0-amd64.deb
sudo dpkg -i elasticsearch-7.2.0-amd64.deb
sudo systemctl start elasticsearch
sudo systemctl status elasticsearch

Install Kibana:
wget https://artifacts.elastic.co/downloads/kibana/kibana-7.2.0-amd64.deb
sudo dpkg -i kibana-7.2.0-amd64.deb
sudo systemctl start kibana
sudo systemctl status kibana
Install Logstash:
wget https://artifacts.elastic.co/downloads/logstash/logstash-7.2.0.deb
sudo dpkg -i logstash-7.2.0.deb
sudo systemctl start logstash
sudo systemctl status logstash
Install Dependencies:sudo apt-get install -y apt-transport-https
Install FileBeat:
wget https://artifacts.elastic.co/downloads/beats/filebeat/filebeat-7.2.0-amd64.deb
sudo dpkg -i filebeat-7.2.0-amd64.deb
sudo systemctl start filebeat
sudo systemctl status filebeat
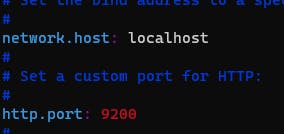
Modify Elasticsearch yaml file:
sudo vi /etc/elasticsearch/elasticsearch.yml
* make a few changes in this file as given below,
\ uncomment the highlighted lines and give the fields as given in the screenshots*
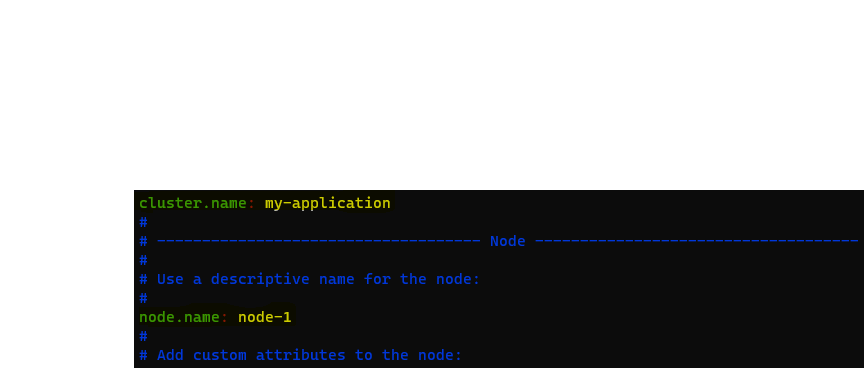
sudo systemctl restart elasticsearch
Modify kibana yaml file:
sudo vi /etc/kibana/kibana.yml
* make below changes as shown in the screenshot
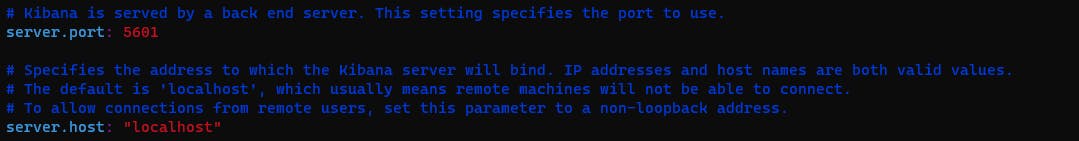
sudo systemctl restart kibana
sudo systemctl status kibana
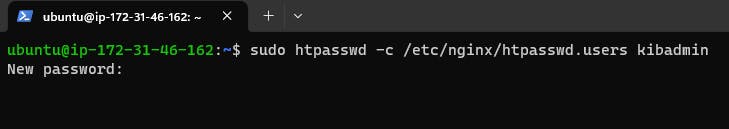
Note: Here, we are gonna access kibana via nginx, that means we access the nginx server where nginx redirects it to the kibana url. in this scenario nginx acts as reverse-proxy server & creating an kibana admin user and passwd.
sudo apt-get install -y apache2-utils
sudo htpasswd -c /etc/nginx/htpasswd.users kibadmin
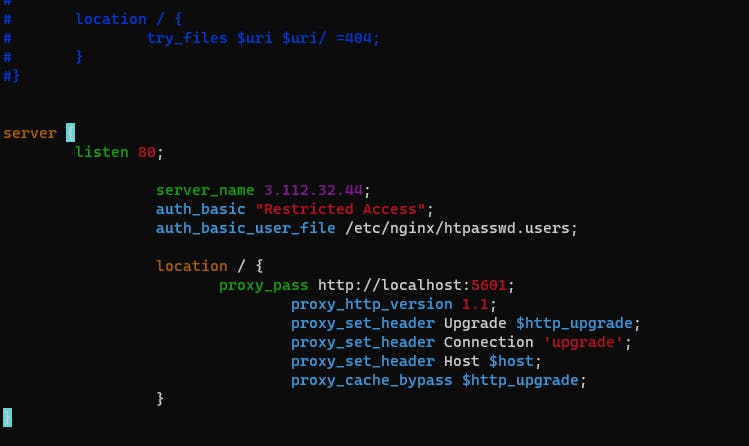
sudo vi /etc/nginx/sites-available/default
Add the below-given template in the default file in the last (end of the file).
**
server {
listen 80;
server_name <instance public-IP>;
auth_basic "Restricted Access";
auth_basic_user_file /etc/nginx/htpasswd.users;
location / {
proxy_pass localhost:5601;
proxy_http_version 1.1;
proxy_set_header Upgrade $http_upgrade;
proxy_set_header Connection 'upgrade';
proxy_set_header Host $host;
proxy_cache_bypass $http_upgrade;
}
}
**
restart the nginx -> sudo systemctl restart nginx
Accessing the Kibana Dashboard
copy and paste the instance IP address in browser , provide the user-id& password.
Add the sample web-server logs to have kibana dashboard with sample web-logs.
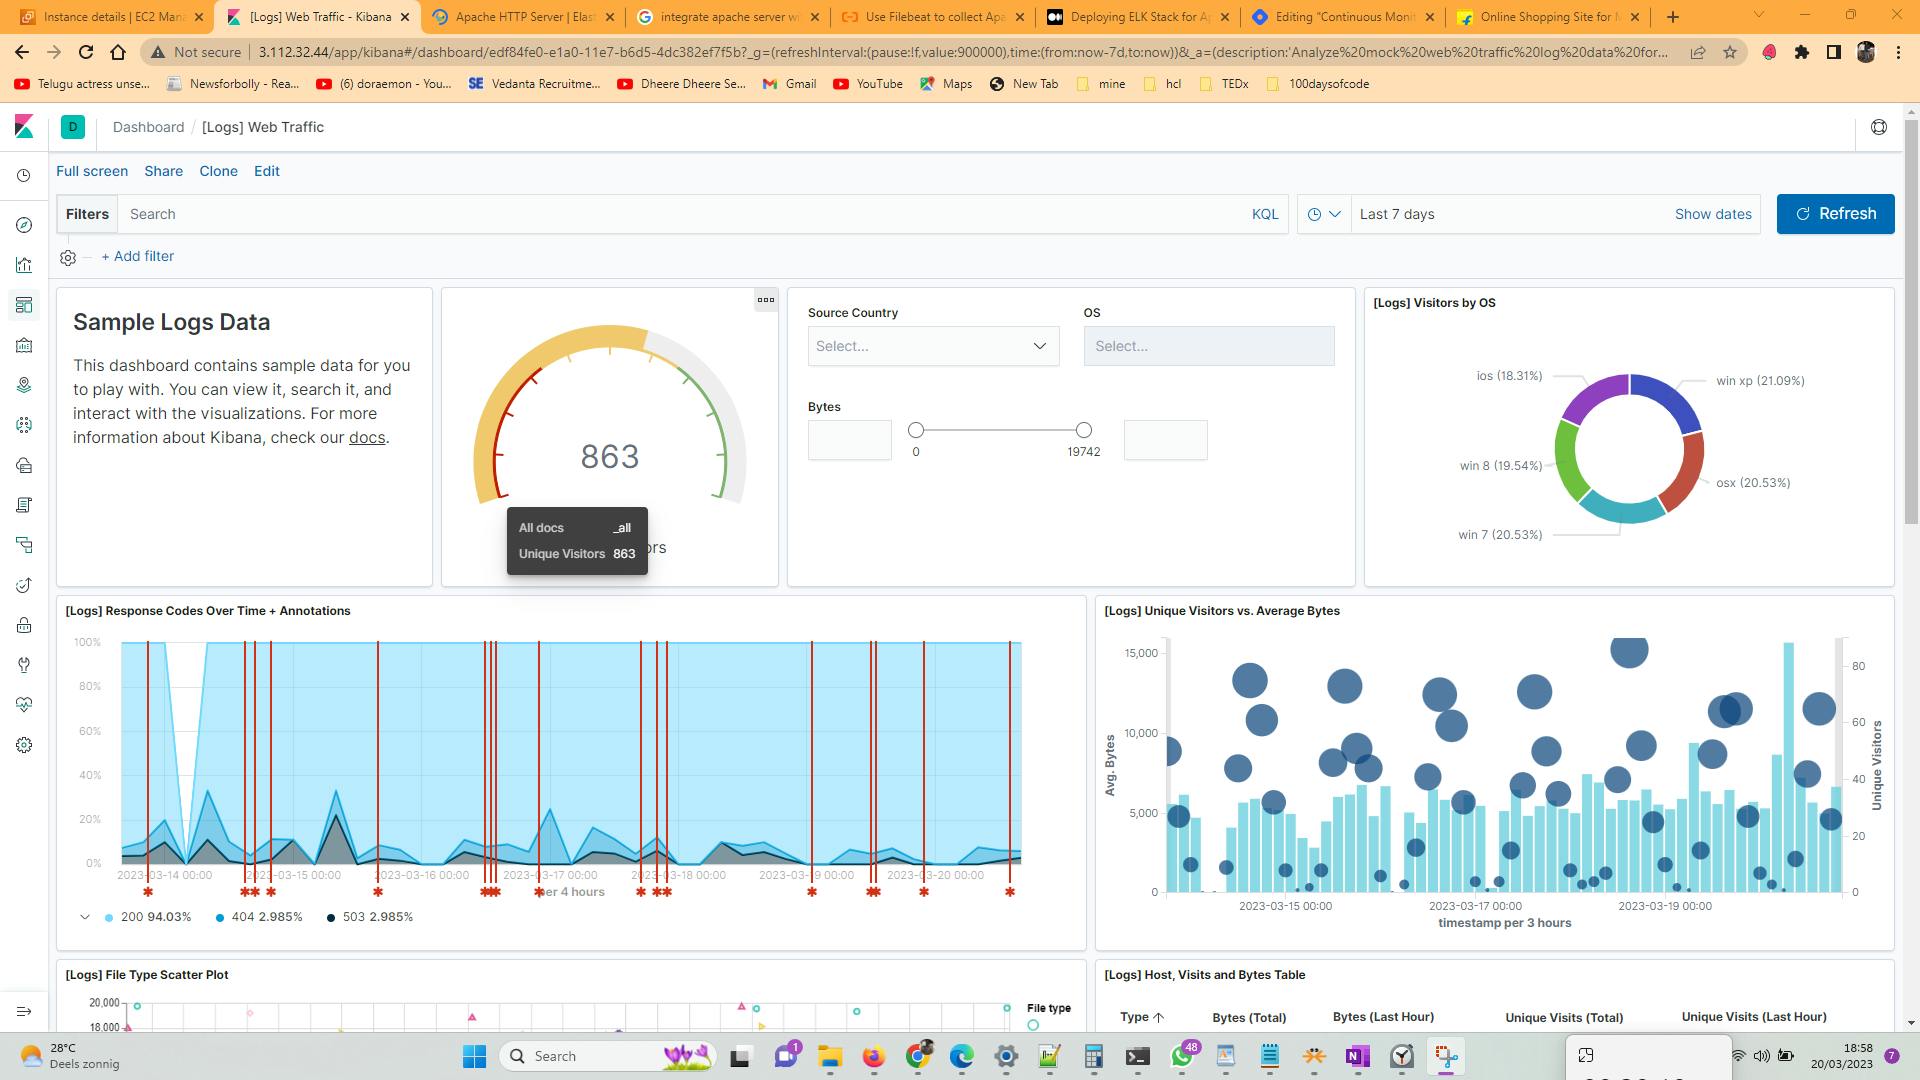
This is how the kibana Dashboard with sample web logs looks like..