NewRelic Installation on Amazon-Linux and Integrating with EKS (Kubernetes)
Live, Real-Time Monitoring of systems with Visualization

Skilled DevOps Engineer with hands-on experience supporting, automating, and optimizing mission critical deployments in AWS, leveraging configuration management, CI/CD, and DevOps processes.
What is New-Relic, Uses and How is it deployed in the DevOps methodologies?
New Relic is a cloud-based software analytics tool that helps companies monitor, troubleshoot, and optimize their applications and infrastructure in real-time. New Relic offers a wide range of features and capabilities, including application performance monitoring (APM), real user monitoring (RUM), infrastructure monitoring, and synthetic monitoring.
With New Relic, companies can gain valuable insights into their software systems, including the performance of individual components, the impact of code changes on performance, and the overall health of their applications and infrastructure. This information can help companies identify and address issues before they become major problems, improve the user experience, and optimize system performance.
New Relic supports a wide range of programming languages, platforms, and technologies, including Java, .NET, Node.js, Python, Ruby, AWS, and Microsoft Azure. It also integrates with popular DevOps tools and platforms, such as Jenkins, Kubernetes, and Docker, making it a powerful tool for teams practising agile and DevOps methodologies.
Here, We will use the New-Relic tool for Live Monitoring of PODs (micro-services) by integrating it with the EKS cluster.
Before Working on setting-up New-Relic, Do set up the EKS cluster in the AWS cloud,
Please Find the here, EKS Cluster Set-up
New-Relic Set-Up and Integrating with EKS cluster:
sign-up for the New-Relic here,
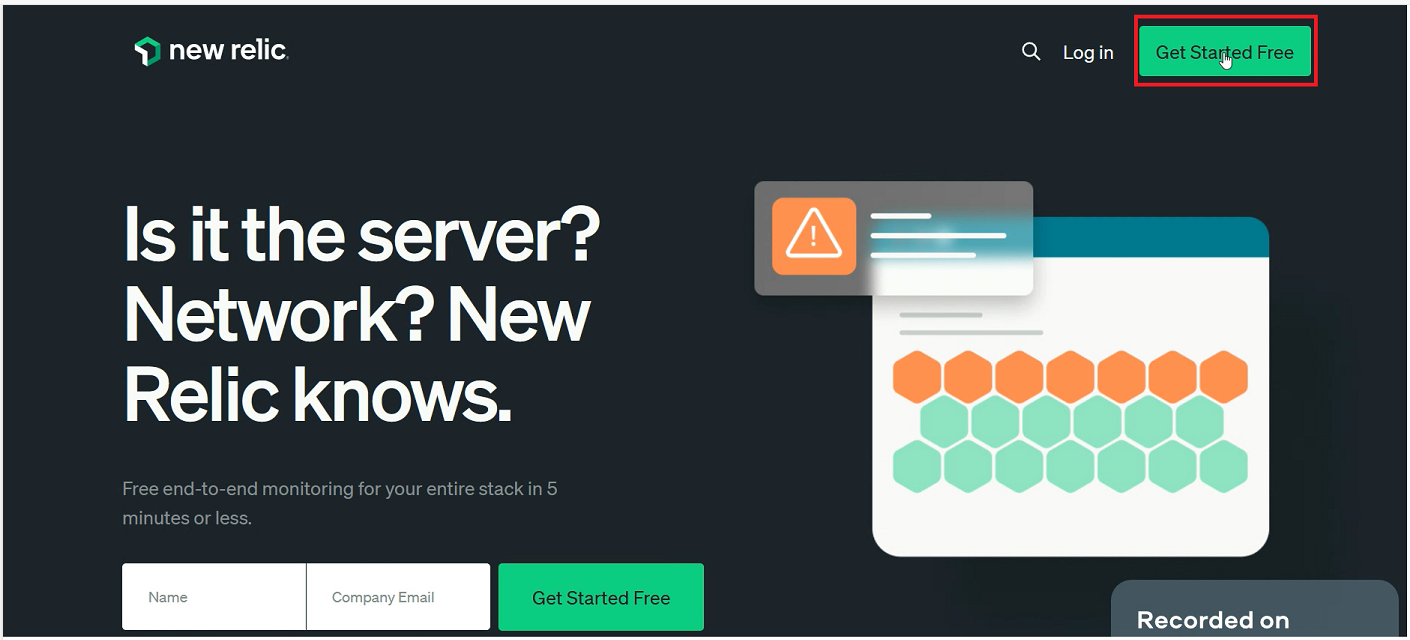
Give the Name and Email-id and Proceed, You will get and verification link to your email-id, Click on the link

Create a Password

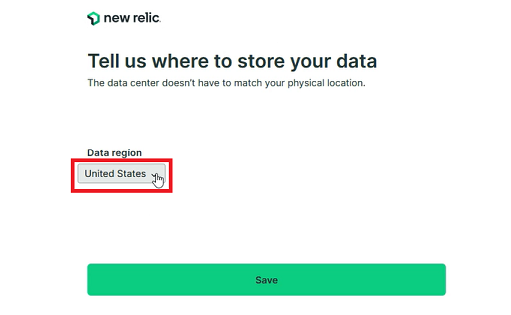
Select the US-Region
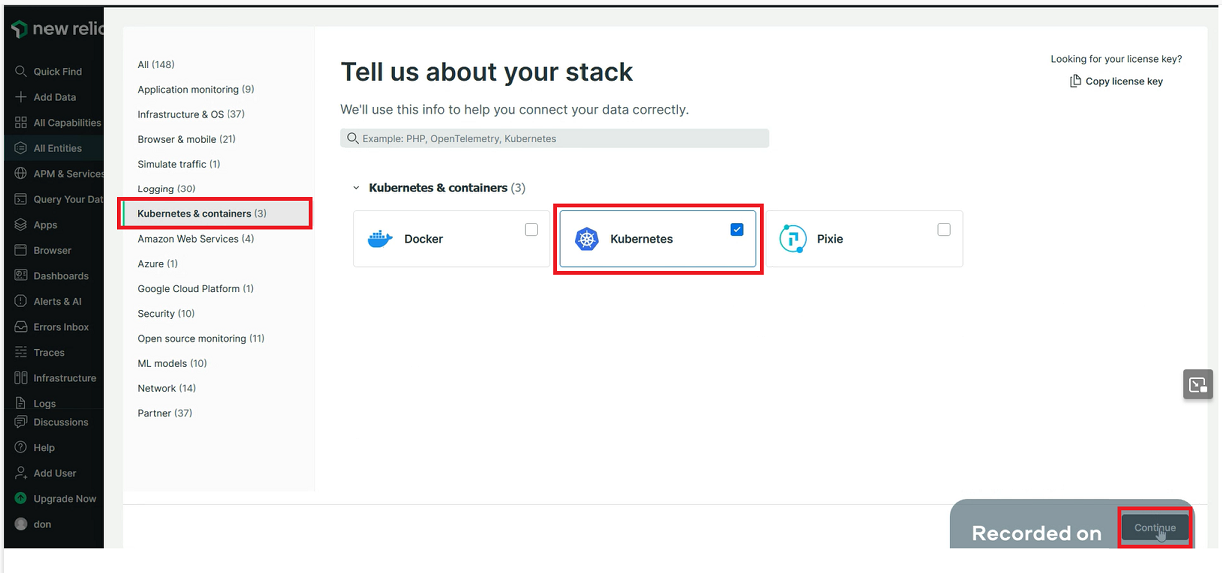
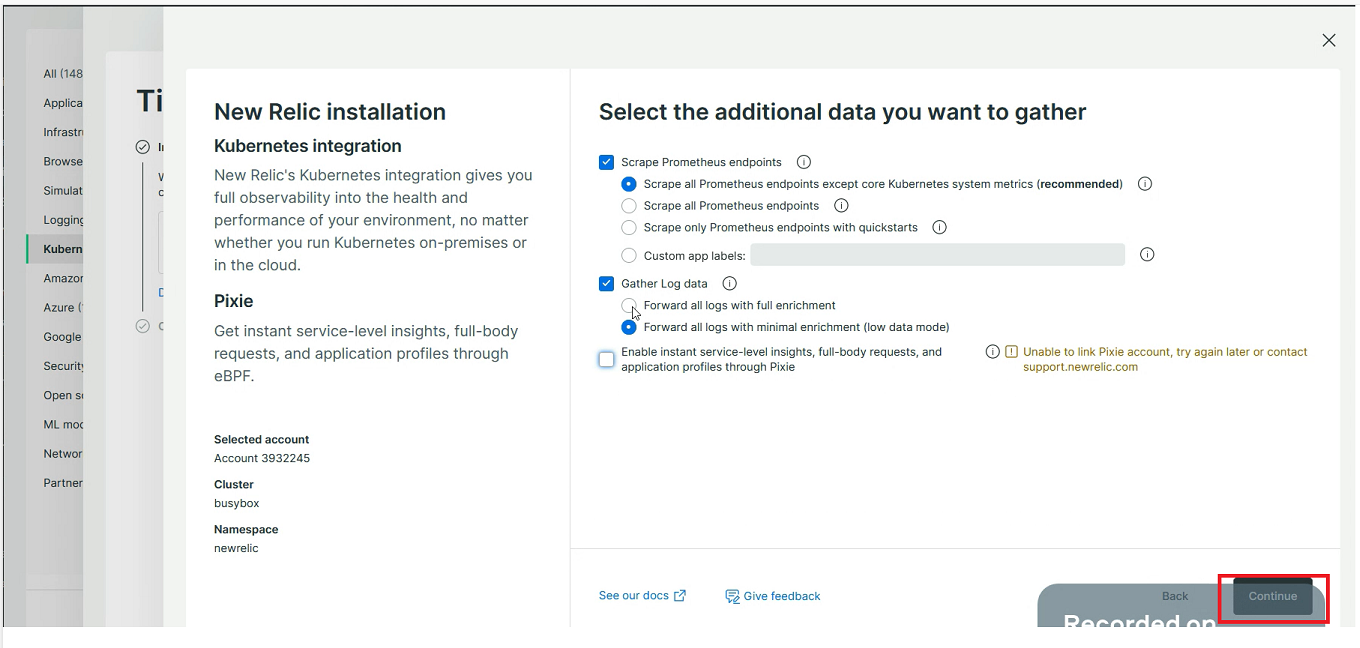
Select on Highlighted area

Give the EKS-Cluster name in the below tab
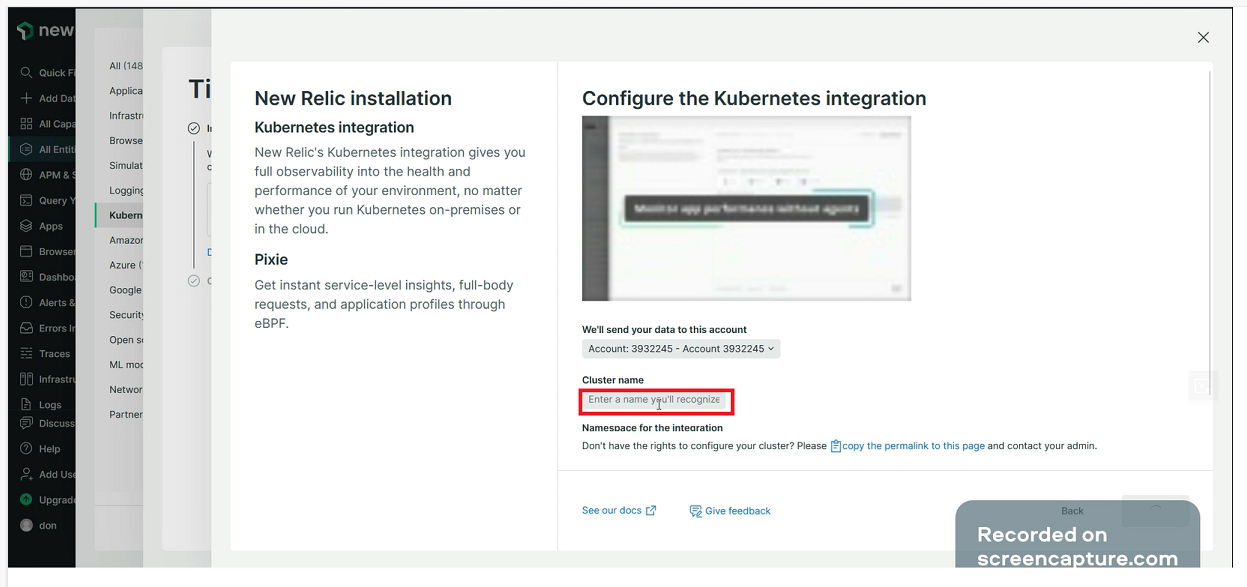
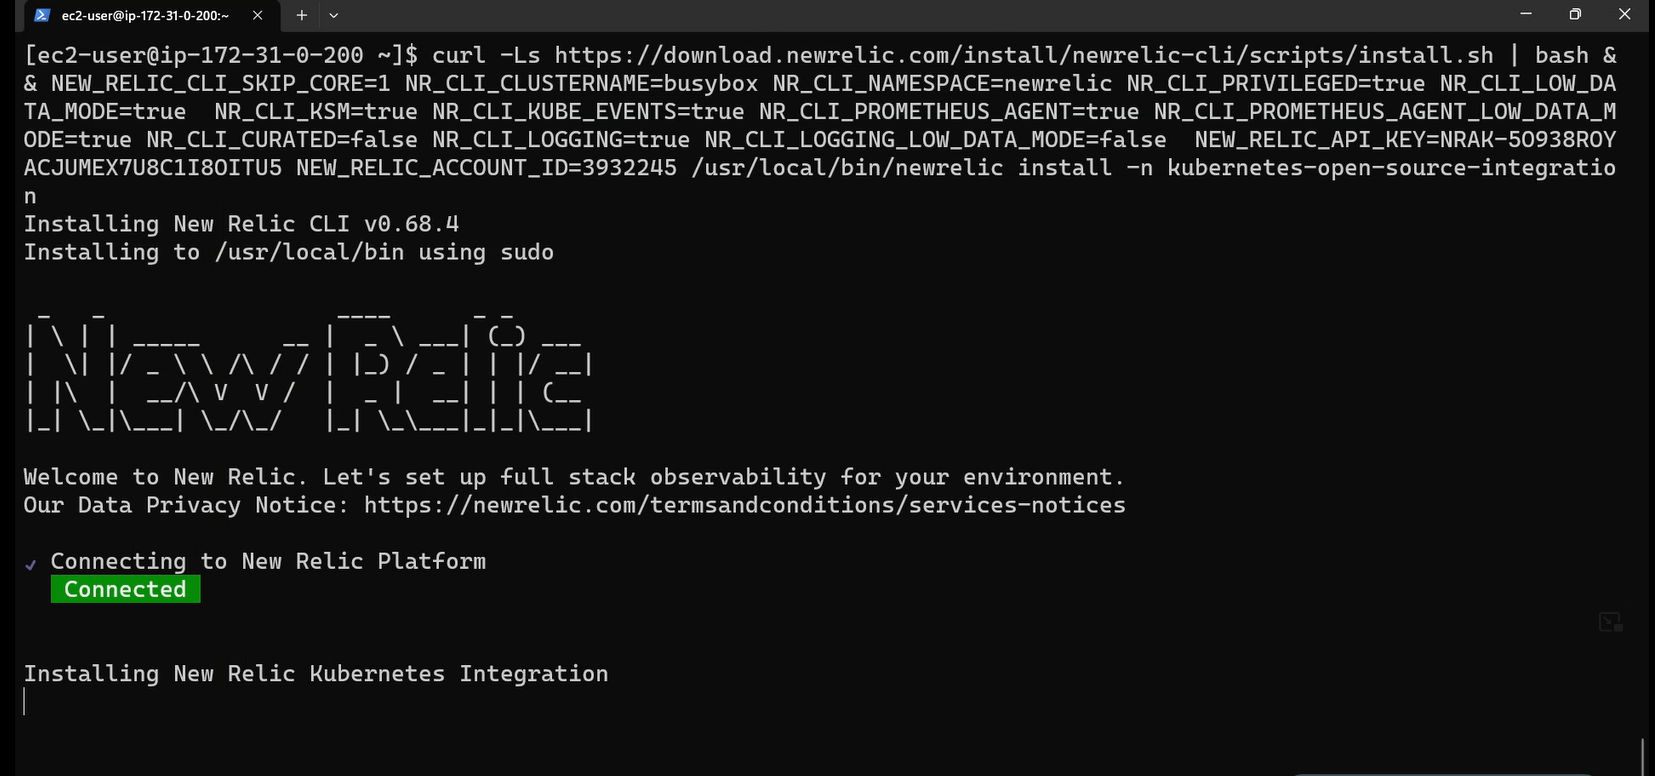
Copy the command and Paste it onto the instance terminal where we installed kubectl tool.

It takes around 3 to 5 mins to process and install the New-Relic Pods on EKS-Cluster.
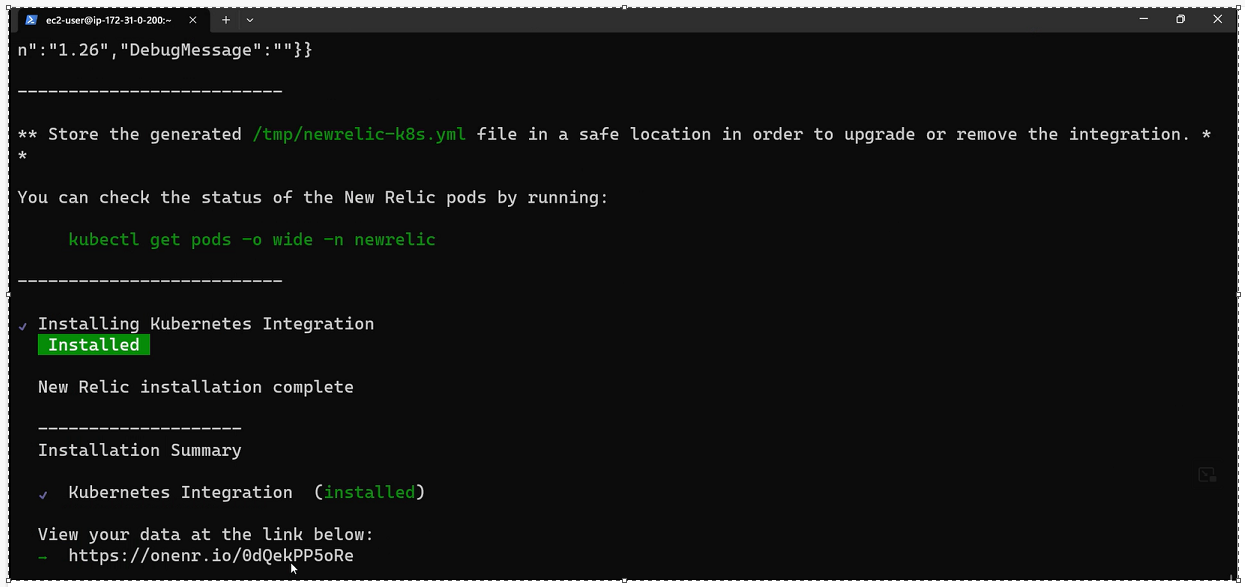
Run the command kubectl get pods --all-namespaces, You will see the new-relic agent pods running on the EKS-Cluster

Come back to the New-Relic dashboard, This page takes almost 5 to 10mins to proceed forward, then click on continue as highlighted in the below screenshot

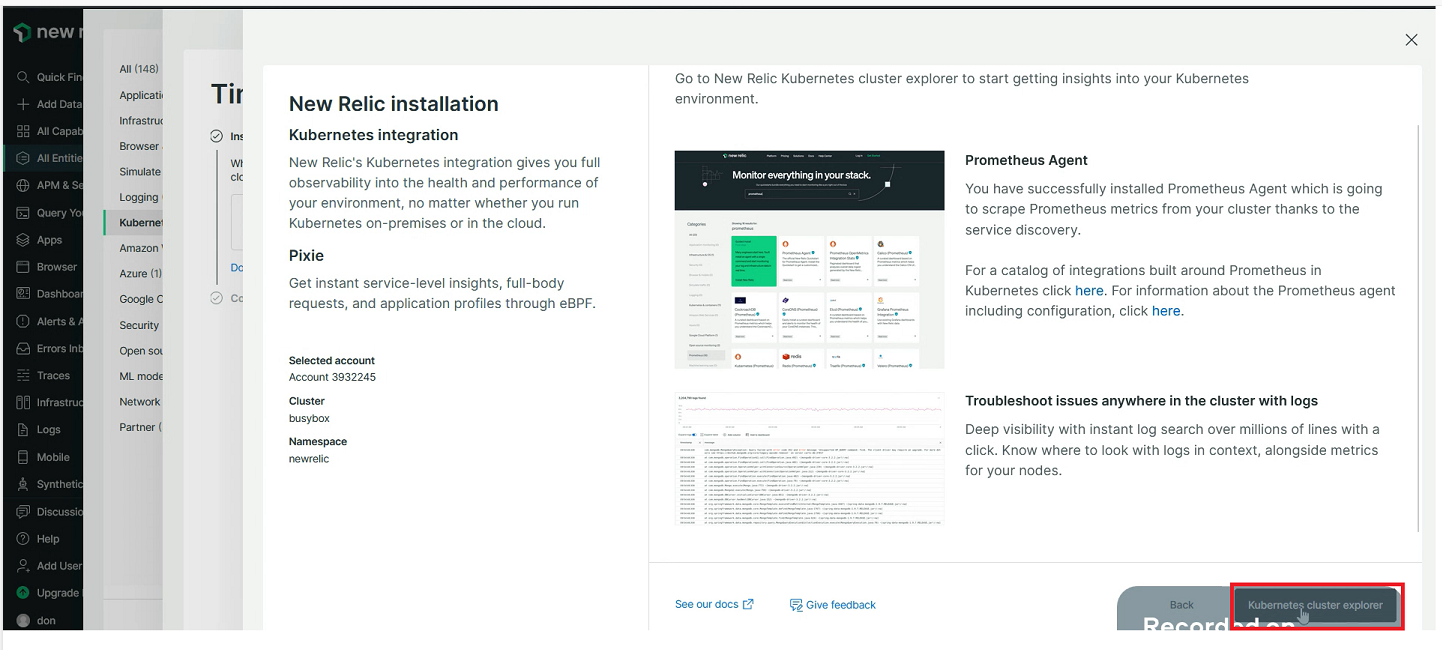
Now, you can see your whole EKS cluster events on New-Relic along with their status in a visualized form
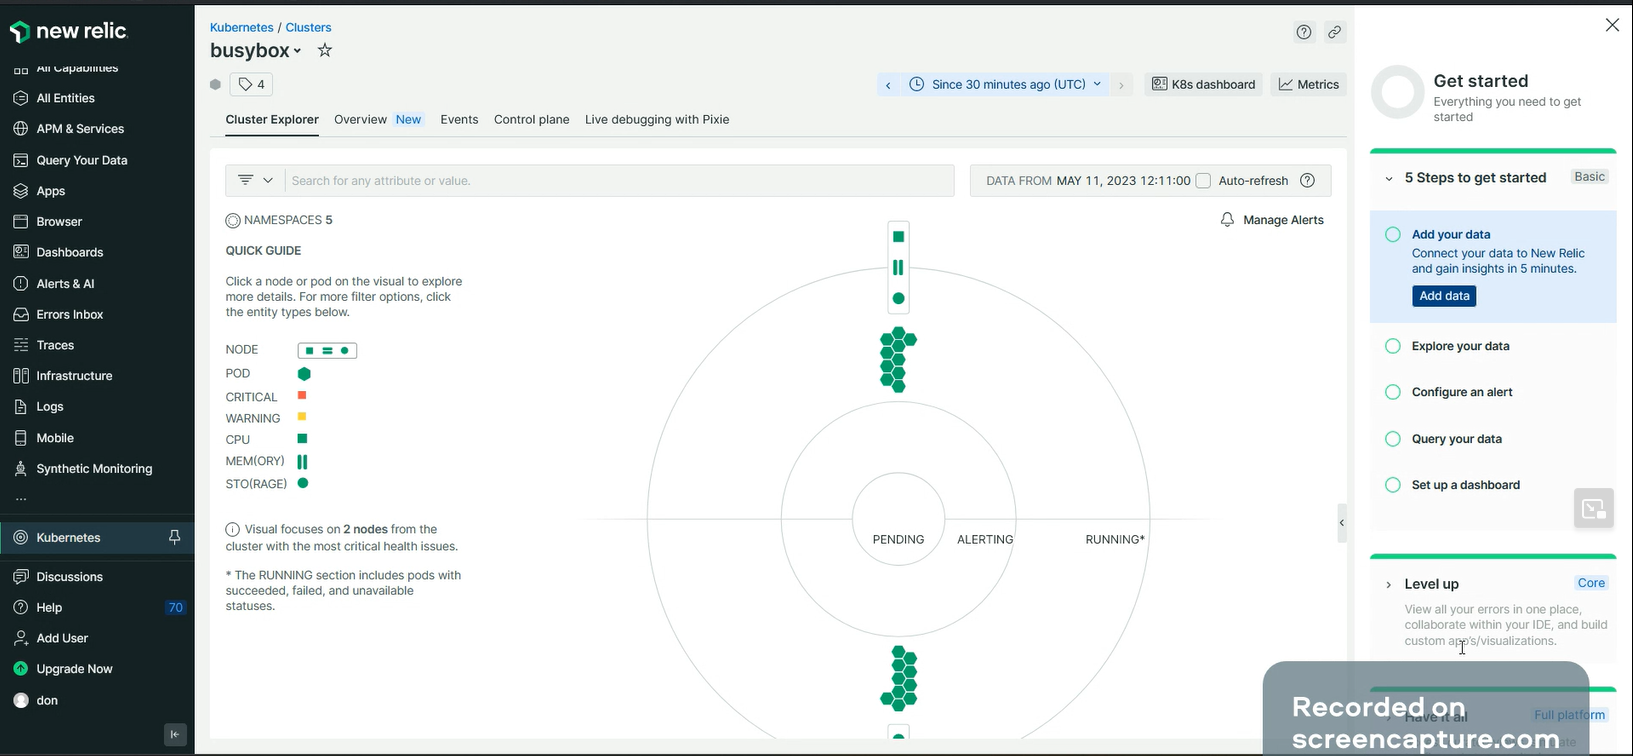
Click on the Highlighted tabs, to see the deployed PODs' status
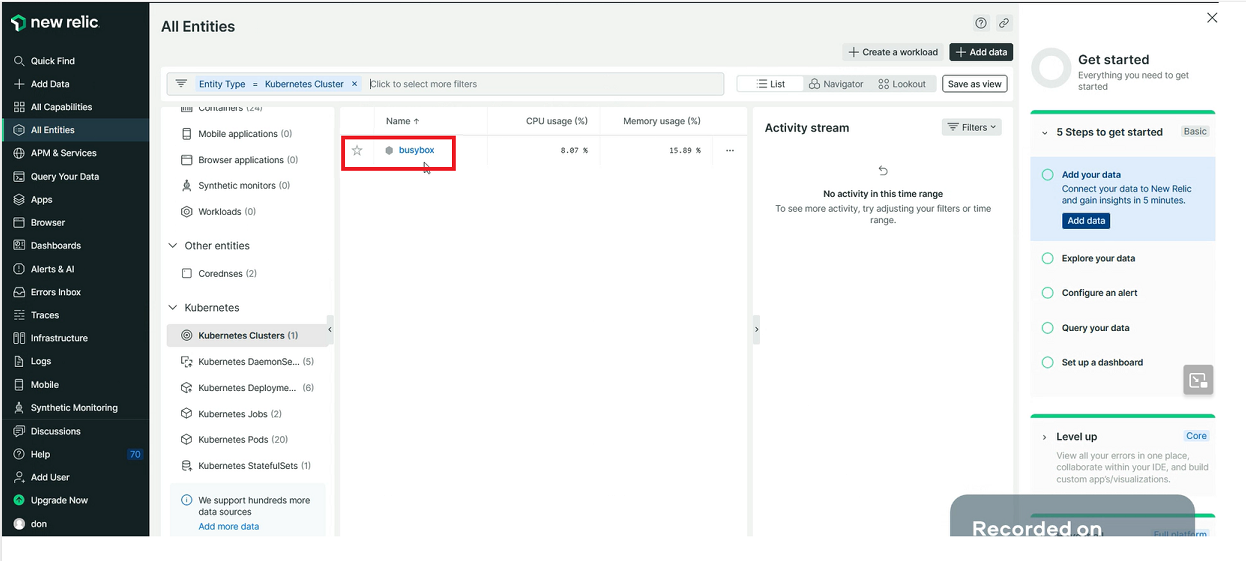
Here, busybox is the name of my EKS-CLuster name. Just click on it
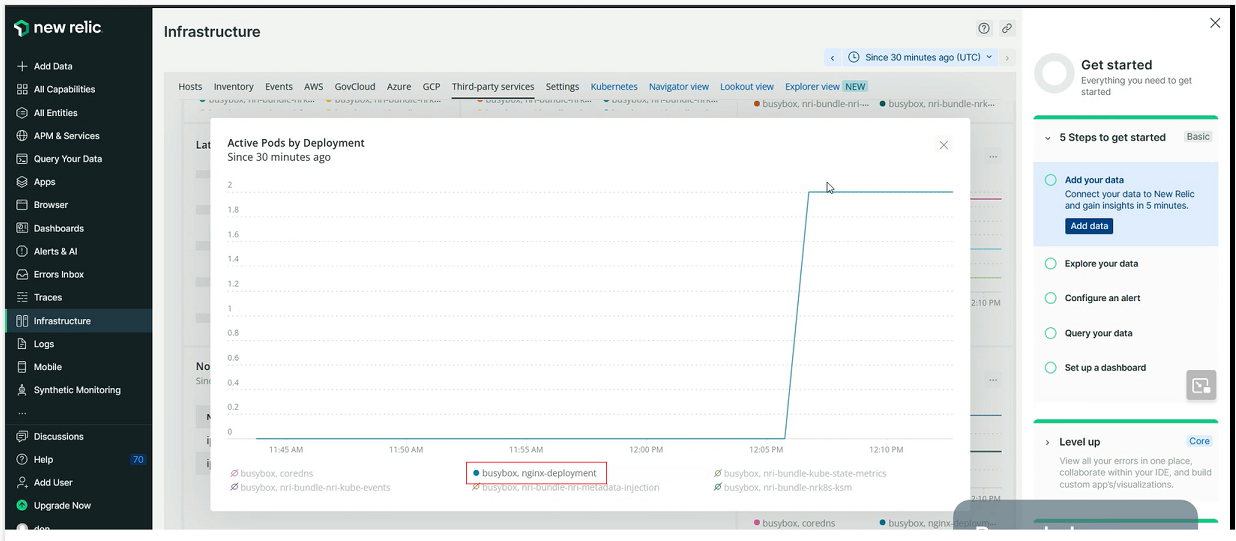
Click on the number 3 tab, where you can see the PODs status of deployment

In the highlighted box, the nginx-deployment pod is the one which I deployed using deployment.yaml file, which is running perfectly without any fluctuations.
This way we can Explore as much as we can, and also can create your dashboards as per requirements.
\==============x=================x===============x=============


