Installing and configuring ELASTIC-STACK (Elasticsearch, Logstash, Beat &Kibana) on Amazon-linux

Skilled DevOps Engineer with hands-on experience supporting, automating, and optimizing mission critical deployments in AWS, leveraging configuration management, CI/CD, and DevOps processes.
Please find all about the continuous monitoring using ELK and installation of elastic search, logstash, filebeat and kibana on ubuntu at https://naresh-devops.hashnode.dev/continuous-monitoring-using-elk
ELK stack - Logging and Monitoring Tool

Continuous Log monitoring setup using elk stack tools :


H**ere, we work on the three labs,
Server Monitoring using Metricbeat
Web server logs monitoring using filebeat
csv file through logstash
1) Server Monitoring using Metribeat ;
First, let's install Elasticsearch, Logstash, Kibana and Metricbeat........
Prerequisites:
-> No of Instances: 01
-> Image: Amazon-Linux
-> Instance type: t2.large
-> Storage: 20GiB
Installing & Configuring Elasticsearch :
please refer to the below-given link for Eelasticsearch installation & related docs https://www.elastic.co/guide/en/elasticsearch/reference/7.2/rpm.html
we install all the ELK stack tools using RPM
sudo yum install java-1.8.0 -y
sudo rpm --import https://artifacts.elastic.co/GPG-KEY-elasticsearch
wget https://artifacts.elastic.co/downloads/elasticsearch/elasticsearch-7.9.3-x86_64.rpm
sudo rpm --install elasticsearch-7.9.3-x86_64.rpm
sudo /bin/systemctl daemon-reload
sudo /bin/systemctl enable elasticsearch.service
sudo systemctl start elasticsearch.service
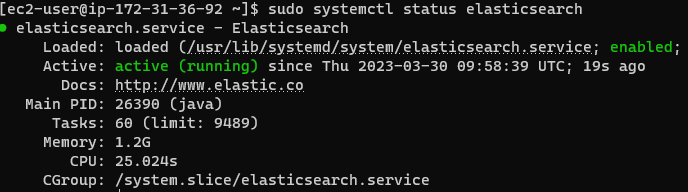
sudo systemctl status elasticsearch
Installing and Configuring Kibana :
sudo rpm --import https://artifacts.elastic.co/GPG-KEY-elasticsearch
wget https://artifacts.elastic.co/downloads/kibana/kibana-7.9.3-x86_64.rpm
sudo rpm --install kibana-7.9.3-x86_64.rpm
sudo /bin/systemctl daemon-reload
sudo /bin/systemctl enable kibana.service
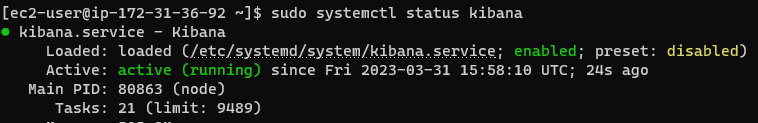
sudo systemctl start kibana.service
Installing and Configuring Logstash:
sudo rpm --import https://artifacts.elastic.co/GPG-KEY-elasticsearch
sudo vi /etc/yum.repos.d/logstash.repo
[logstash-7.x]
name=Elastic repository for 7.x packages
baseurl=https://artifacts.elastic.co/packages/7.x/yum
gpgcheck=1
gpgkey=https://artifacts.elastic.co/GPG-KEY-elasticsearch
enabled=1
autorefresh=1
type=rpm-md
sudo yum install logstash
sudo systemctl start logstash
sudo systemctl status logstash

Modifications in Elasticsearch.yaml, Kibana. yaml files and Installation of nginx server as a Reverse-proxy:
Make a few changes in elasticsearch.yaml file
sudo vi /etc/elasticsearch/elasticsearch.yml
uncomment below the given lines in the elasticsearch.yml file
cluster.name: my-application
node.name: node-1
http.port: 9200


Now restart the elasticsearch # sudo systemctl restart elasticsearch
Make a few changes in the Kibana.yaml file
sudo vi /etc/kibana/kibana.yml
uncomment below the given line in the kibana.yaml file
server.port: 5601

Restart the kibana # sudo systemctl restart kibana
Now use yum to install Nginx and httpd-tools:
sudo yum -y install nginx httpd-tools
Use htpasswd to create an admin user, called "kibanaadmin" (you should use another name), that can access the Kibana web interface:
sudo htpasswd -c /etc/nginx/htpasswd.users kibanaadmin
Enter a password at the prompt. Remember this login, as you will need it to access the Kibana web interface.
Now open the Nginx configuration file in your favourite editor. We will use vi:
sudo vi /etc/nginx/nginx.conf
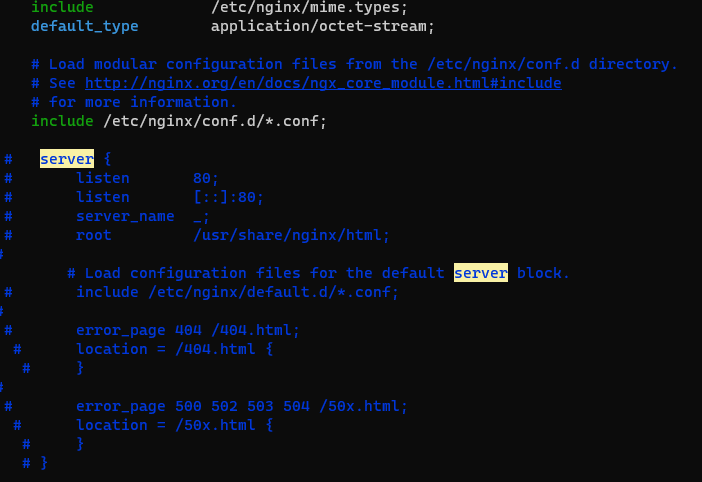
Find the default server block (starts with server {), the last configuration block in the file, and delete it. When you are done, the last two lines in the file should look like this: nginx.conf excerpt
    include /etc/nginx/conf.d/*.conf;
}
Now we will create an Nginx server block in a new file:
sudo vi /etc/nginx/conf.d/kibana.conf
Paste the following code block into the file. Be sure to update the server_name to match your server's name: /etc/nginx/conf.d/kibana.conf
server {
    listen 80;

    server_name <public-ip>;

    auth_basic "Restricted Access";
    auth_basic_user_file /etc/nginx/htpasswd.users;

    location / {
        proxy_pass http://localhost:5601;
        proxy_http_version 1.1;
        proxy_set_header Upgrade $http_upgrade;
        proxy_set_header Connection 'upgrade';
        proxy_set_header Host $host;
        proxy_cache_bypass $http_upgrade;
    }
}
Save and exit. This configures Nginx to direct your server's HTTP traffic to the Kibana application, which listens on localhost:5601. Also, Nginx will use the htpasswd.users file, that we created earlier, and require basic authentication.
Now start and enable Nginx to put our changes into effect:
sudo systemctl start nginx
sudo systemctl enable nginx
Installing and Configuring Metricbeat:
Metricbeat is used for server and application monitoring
curl -L -O https://artifacts.elastic.co/downloads/beats/metricbeat/metricbeat-7.9.3-x86_64.rpm
sudo rpm -vi metricbeat-7.9.3-x86_64.rpm
sudo systemctl start metricbeat
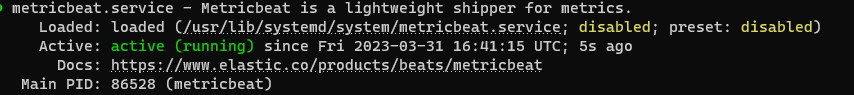
sudo systemctl status metricbeat
sudo metricbeat modules list
This shows us what are all the enabled and disabled modules. Here we can see system module is the only one which enabled and the rest are disabled.
sudo metricbeat modules enable nginx # Here, this command will enable the nginx module
sudo systemctl restart metricbeat
sudo metricbeat setup
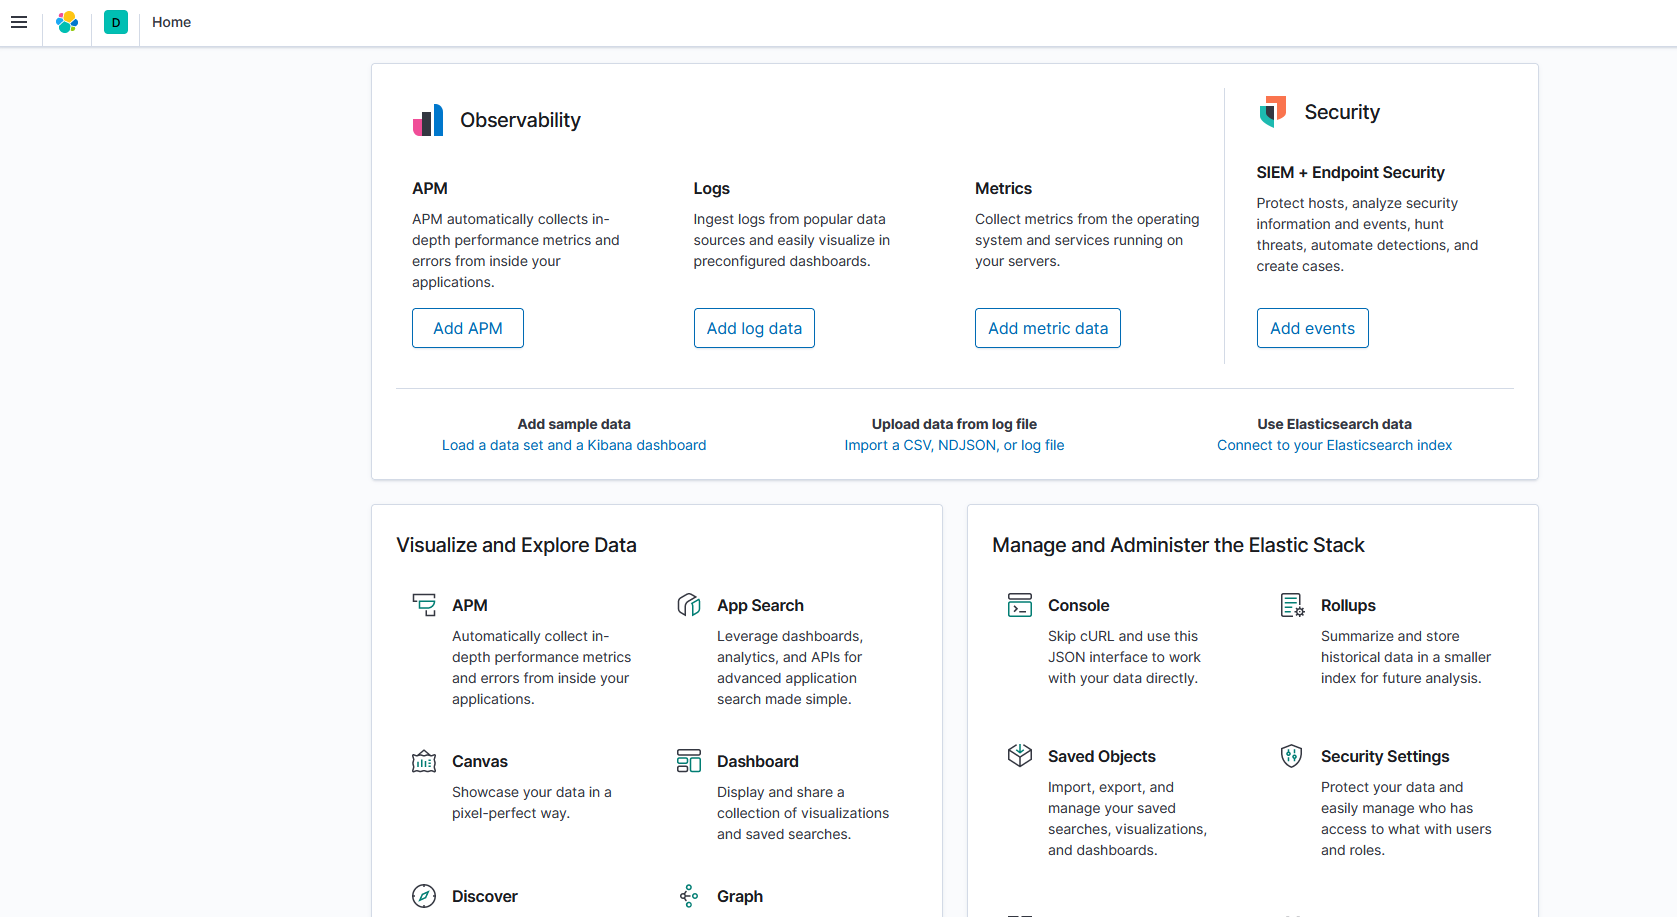
Copy the public IP, search in Browser, and give the nginx configured credentials. Then you will see the kibana dashboard.
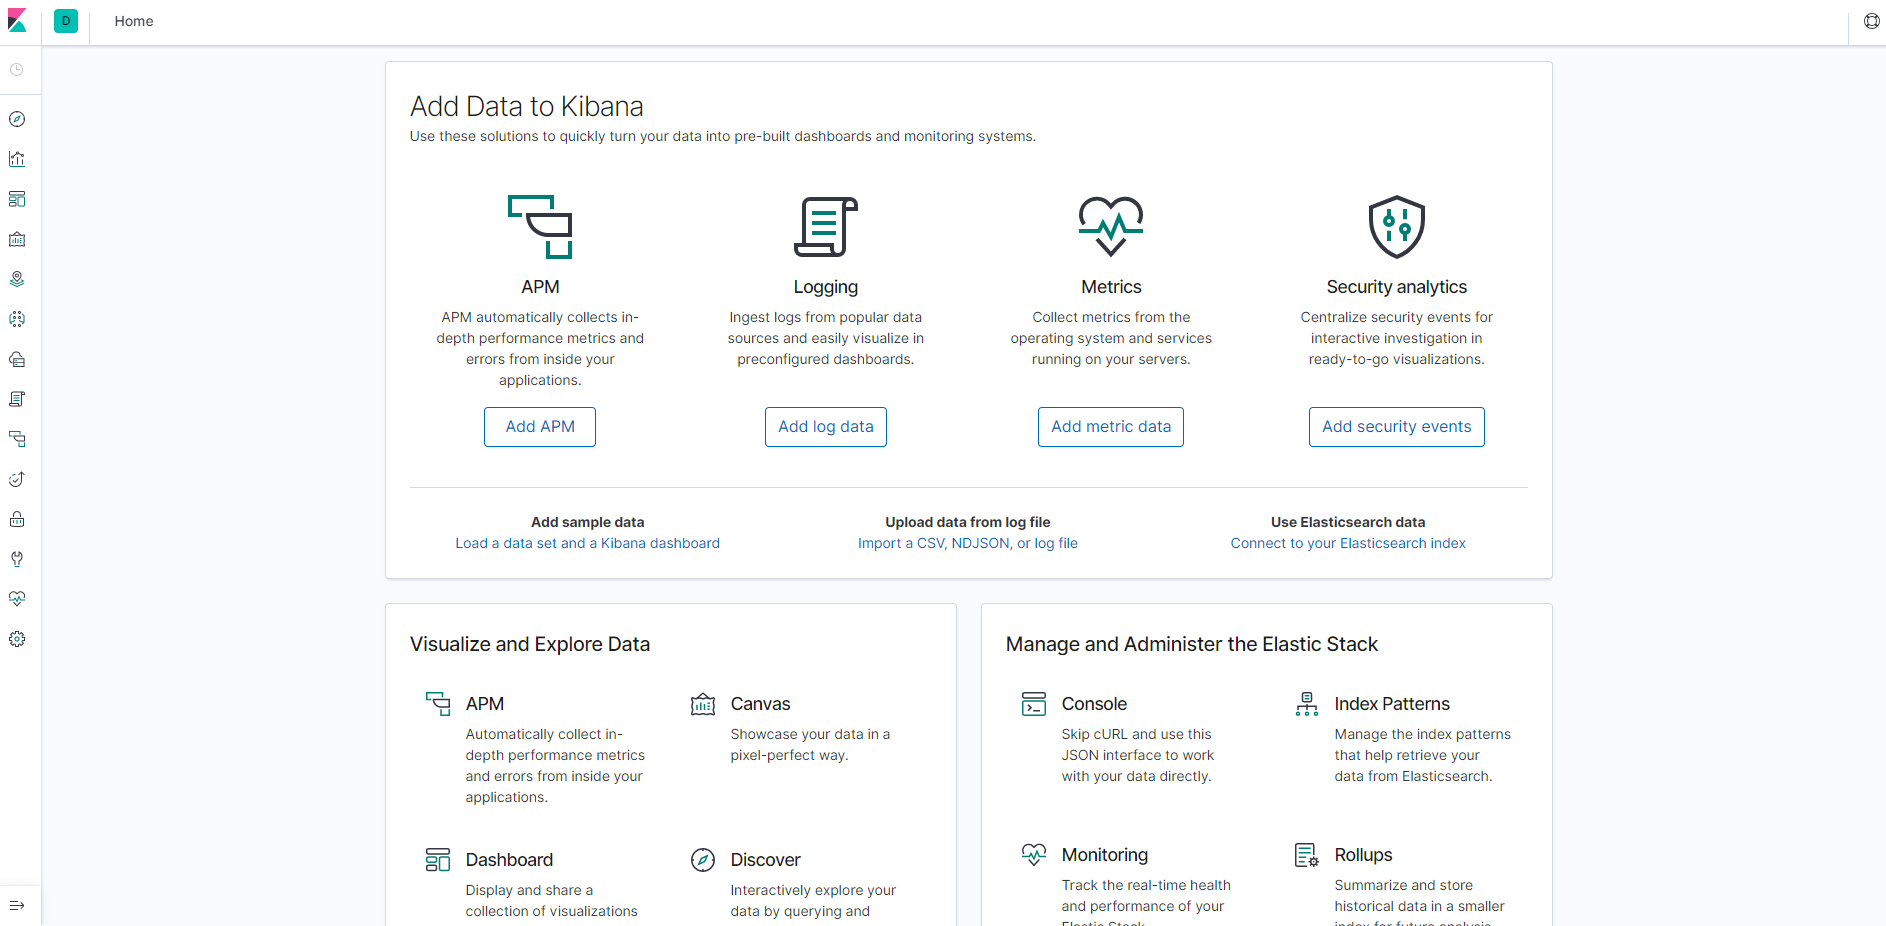
Now, Navigate to the extreme left toggles where we see Dashboard tab and click on it.

Search for "HOST Overview ECS", You will be getting the dashboard METRICS of the HOST.
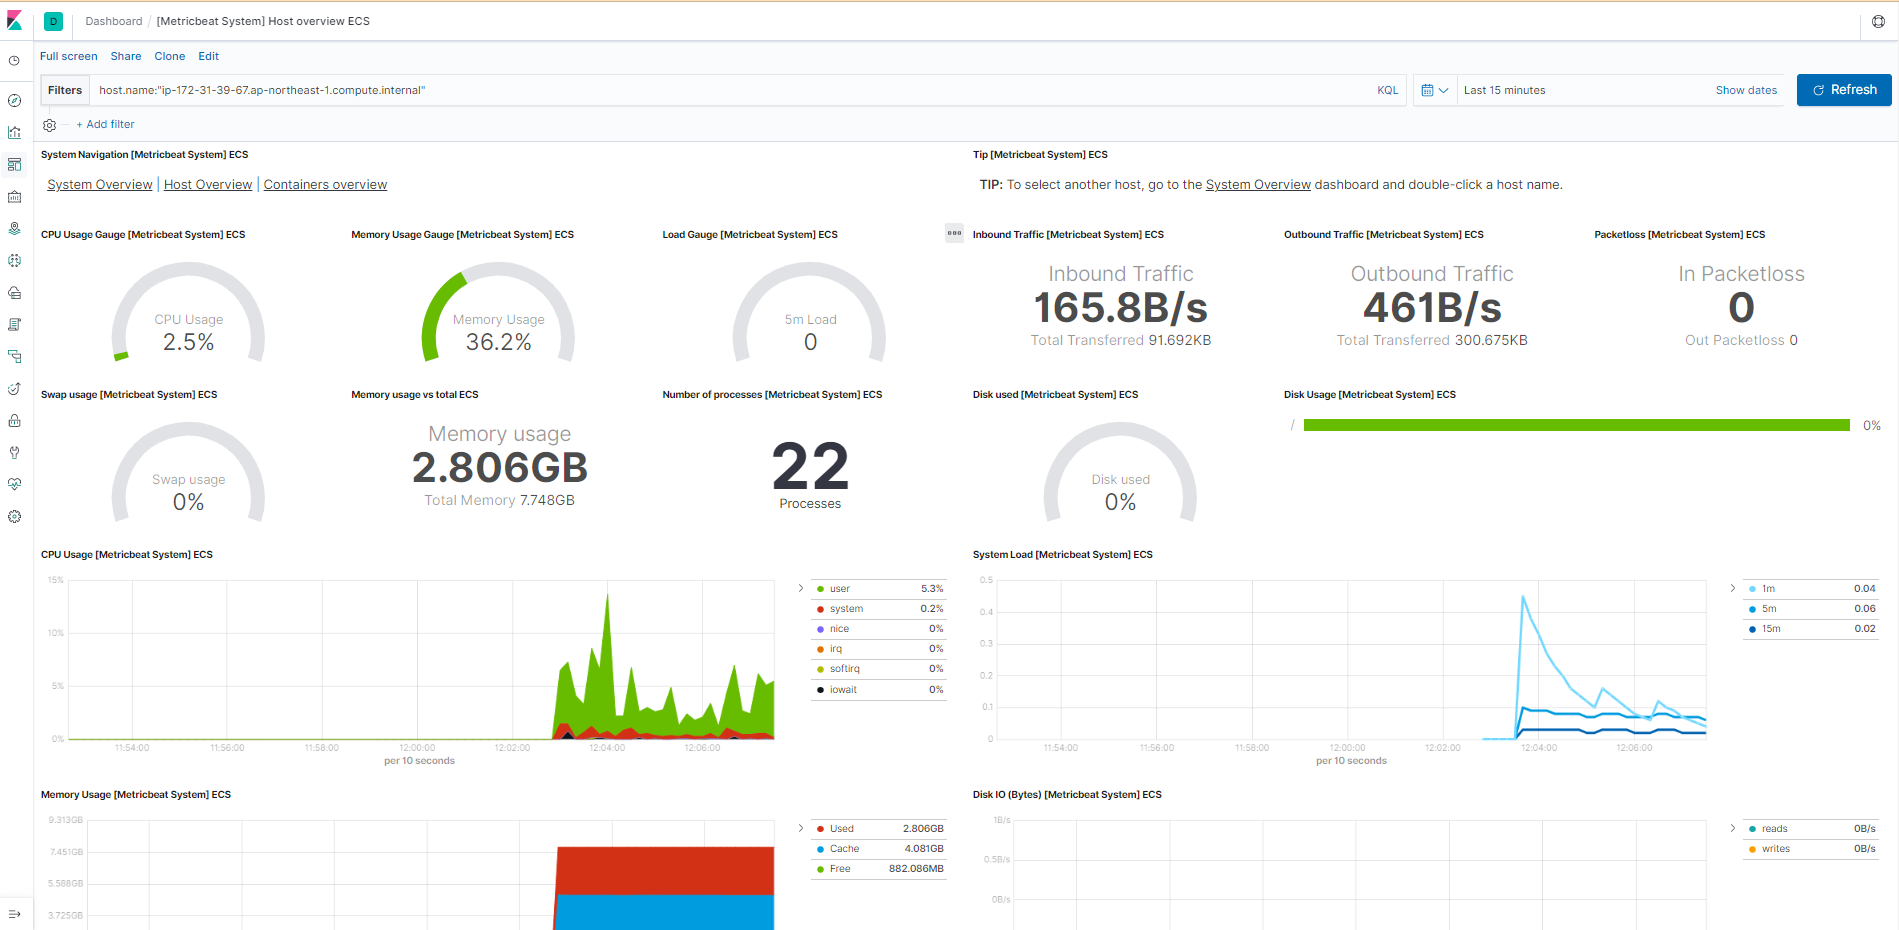
In the above, we have seen "Server monitoring using Metricbeat"
2) Web server logs Monitoring using filebeat:
Install Filebeat
curl -L -O https://artifacts.elastic.co/downloads/beats/filebeat/filebeat-7.9.3-x86_64.rpm

sudo rpm -vi filebeat-7.9.3-x86_64.rpm
Enable and Configure data collection modules
sudo filebeat modules list
sudo filebeat modules enable system nginx
sudo filebeat setup -e
sudo service filebeat start
Copy the instance public-IP and search in the Browser, to get the Kibana UI
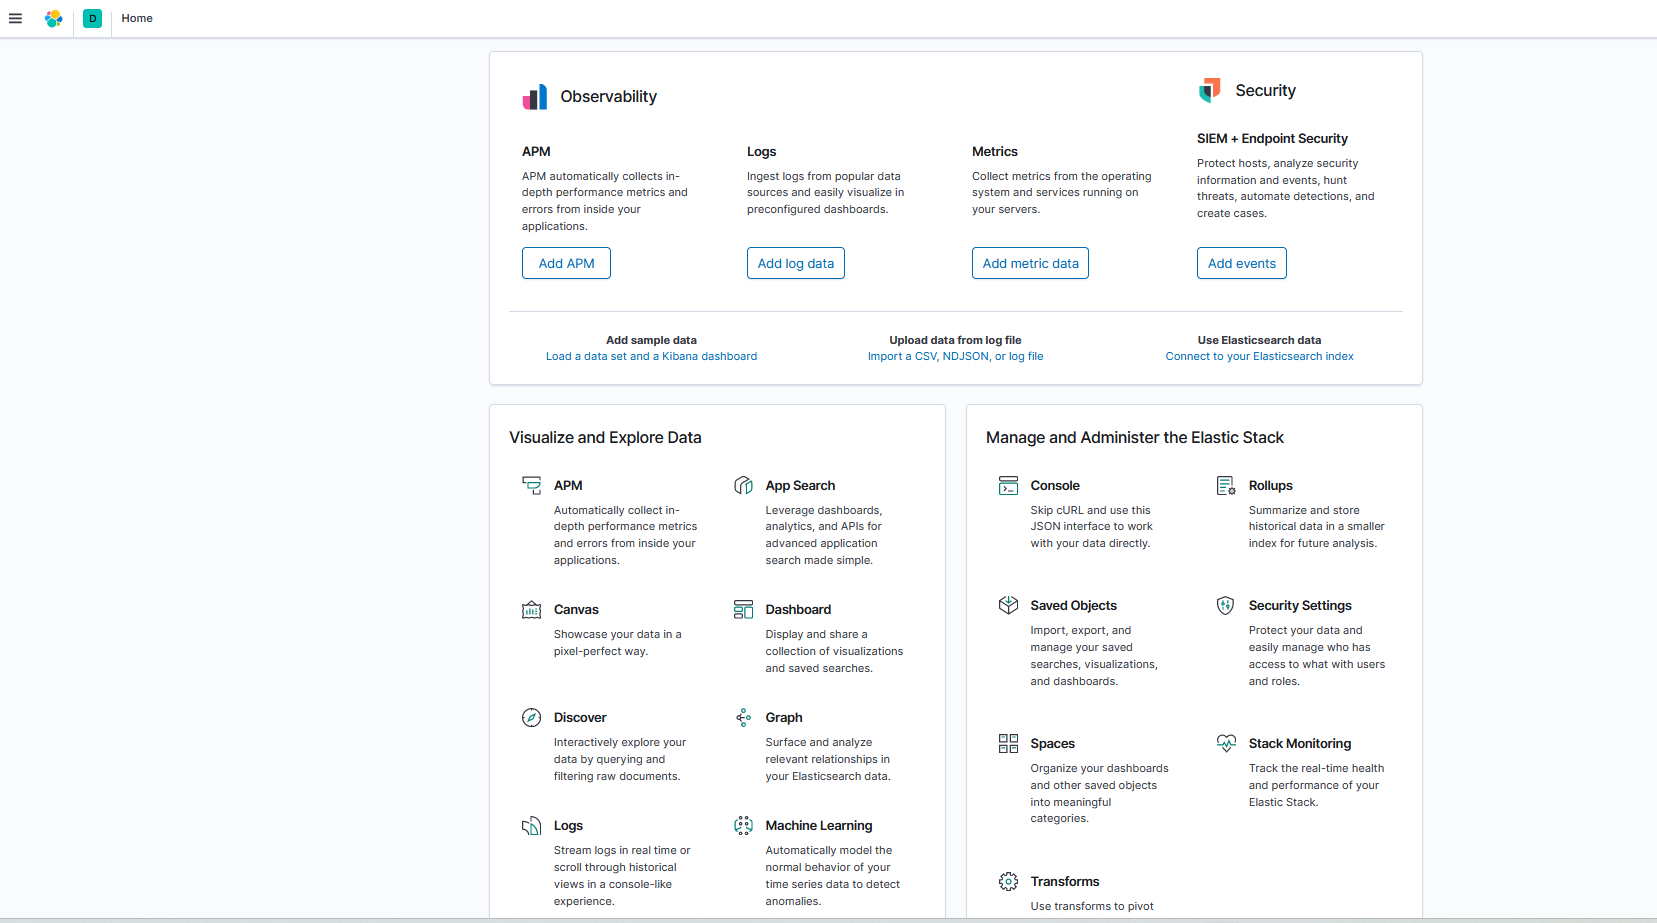
Click on the DASHBOARD tab present onto the extreme left side
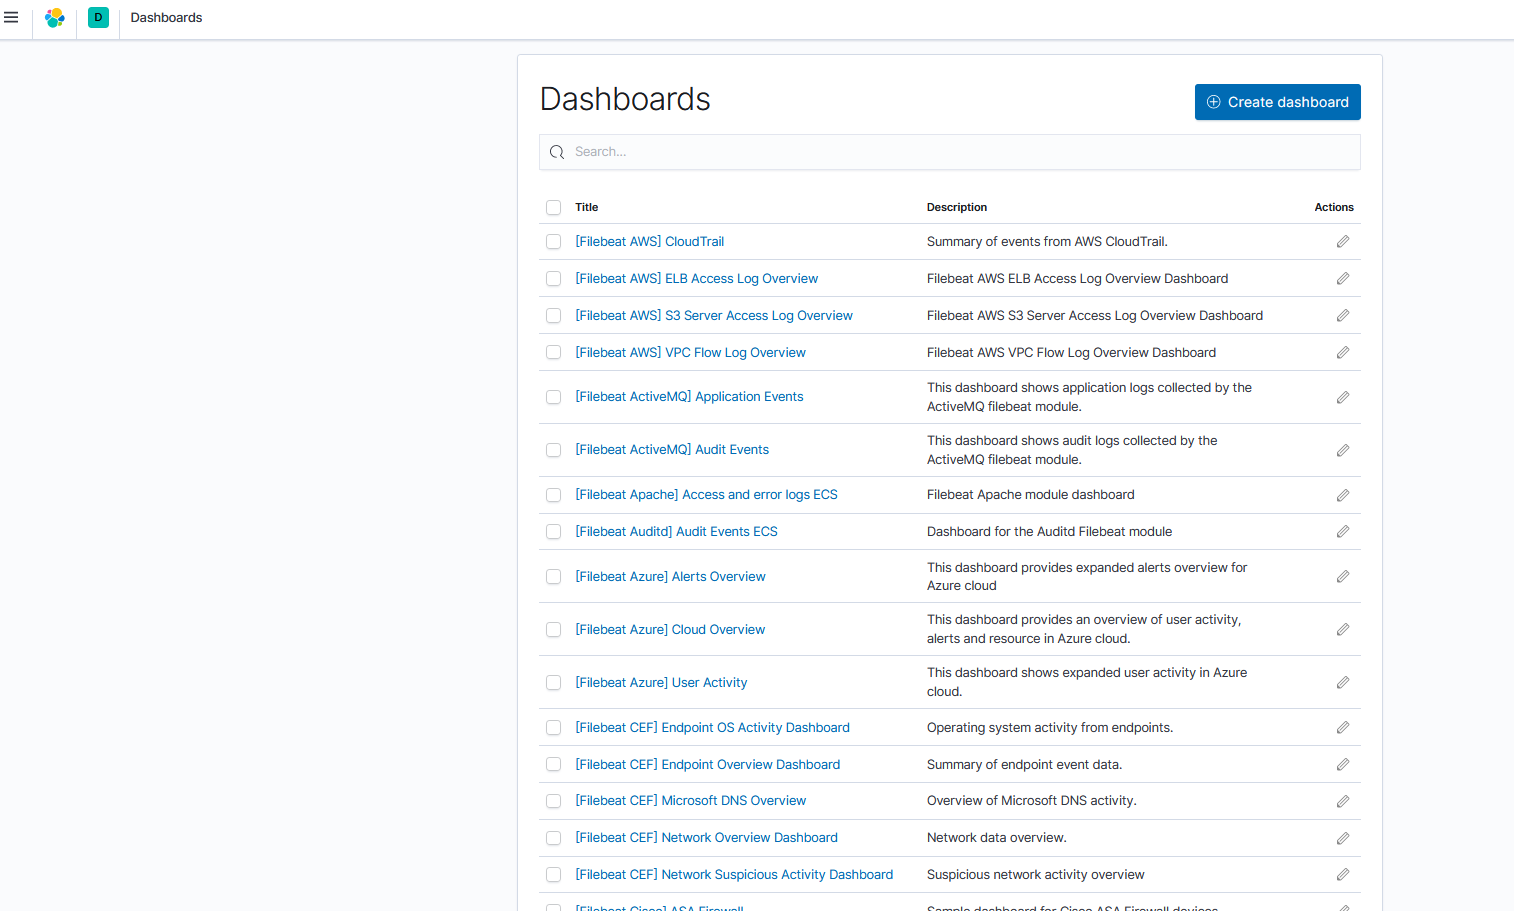
Select the index "[Filebeat Nginx] Overview ECS" to have Kibana metrics of nginx server logs

Click on "[Filebeat Nginx] Overview ECS" Dashboard
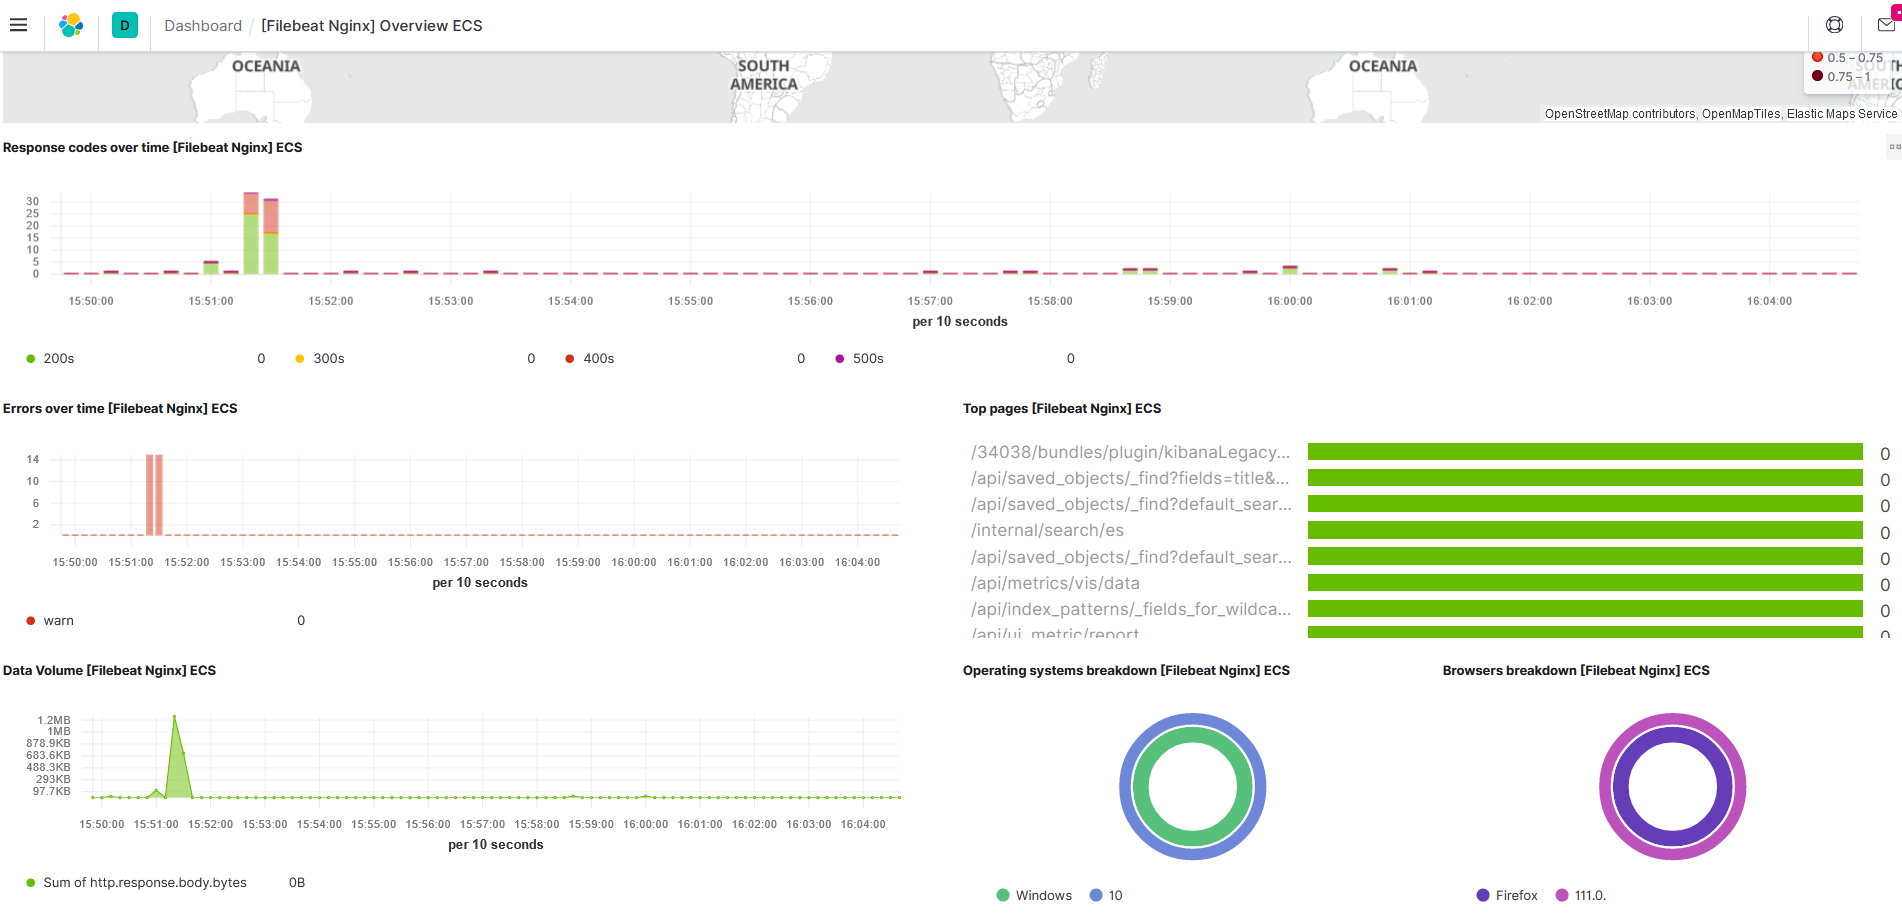
The Above Screenshot shows the Nginx logs Visualisation....
3) csv file through logstash;
Now, we will work on getting logs through logstash to elasticsearch by using CSV (comma-separated value) file which contains some data.
Logstash will inject the data of csv to the elasticsearch and can be viewed in the kibana Visualisation tool.
To get this done, we need to create the Logstash pipeline or data pipeline in the confd directory of logstash tool.
The overview of the pipeline looks like this;

In Beats, as we install, configure and set up, It comes with a pre-created (readymade) Dashboard. But, here in Logstash, we have to create everything manually and the dashboard.
Let's install and configure the Logstash.
Download and install the public signing key:
sudo rpm --import https://artifacts.elastic.co/GPG-KEY-elasticsearch
Add the following in your /etc/yum.repos.d/ directory in a file with a .repo suffix, for example logstash.repo
sudo vi /etc/yum.repos.d/logstash.repo
[logstash-7.x]
name=Elastic repository for 7.x packages
baseurl=https://artifacts.elastic.co/packages/7.x/yum
gpgcheck=1
gpgkey=https://artifacts.elastic.co/GPG-KEY-elasticsearch
enabled=1
autorefresh=1
type=rpm-md
sudo yum install logstash
Now, Create some dummy csv file in /tmp directory
sudo vi /tmp/data.csv
naresh,29,india
kasyap,31,canada
harish,28,USA
rohit,28,france
kittu,29,autralia
it's time to Create the Logstsash pipeline, Navigate and create a file with the named pipeline.conf
sudo vi /etc/logstash/conf.d/pipeline.conf
input {
  file {
    path => "/tmp/data.csv"
    start_position => "begining"
  }
}

filter {
    csv {
        columns => ["name","age","country"]
    }
}

output {
    elasticsearch {
           hosts => ["localhost:9200"]
    }
}
Here, the file { in the pipeline is Logstash plugin and path { , start_position are the parameters,
link for the input plugin where you can find file { https://www.elastic.co/guide/en/logstash/7.9/plugins-inputs-file.html
link for the filter plugin where you find csv { https://www.elastic.co/guide/en/logstash/7.9/filter-plugins.html
link for the output plugin where you can find elasticsearch { https://www.elastic.co/guide/en/logstash/7.9/output-plugins.html
start the logstash sudo systemctl start logstash
Search with the instance Public-IP in the browser (Mozilla-incognito-mode) to get the Logstash index view in the kibana visualisation.
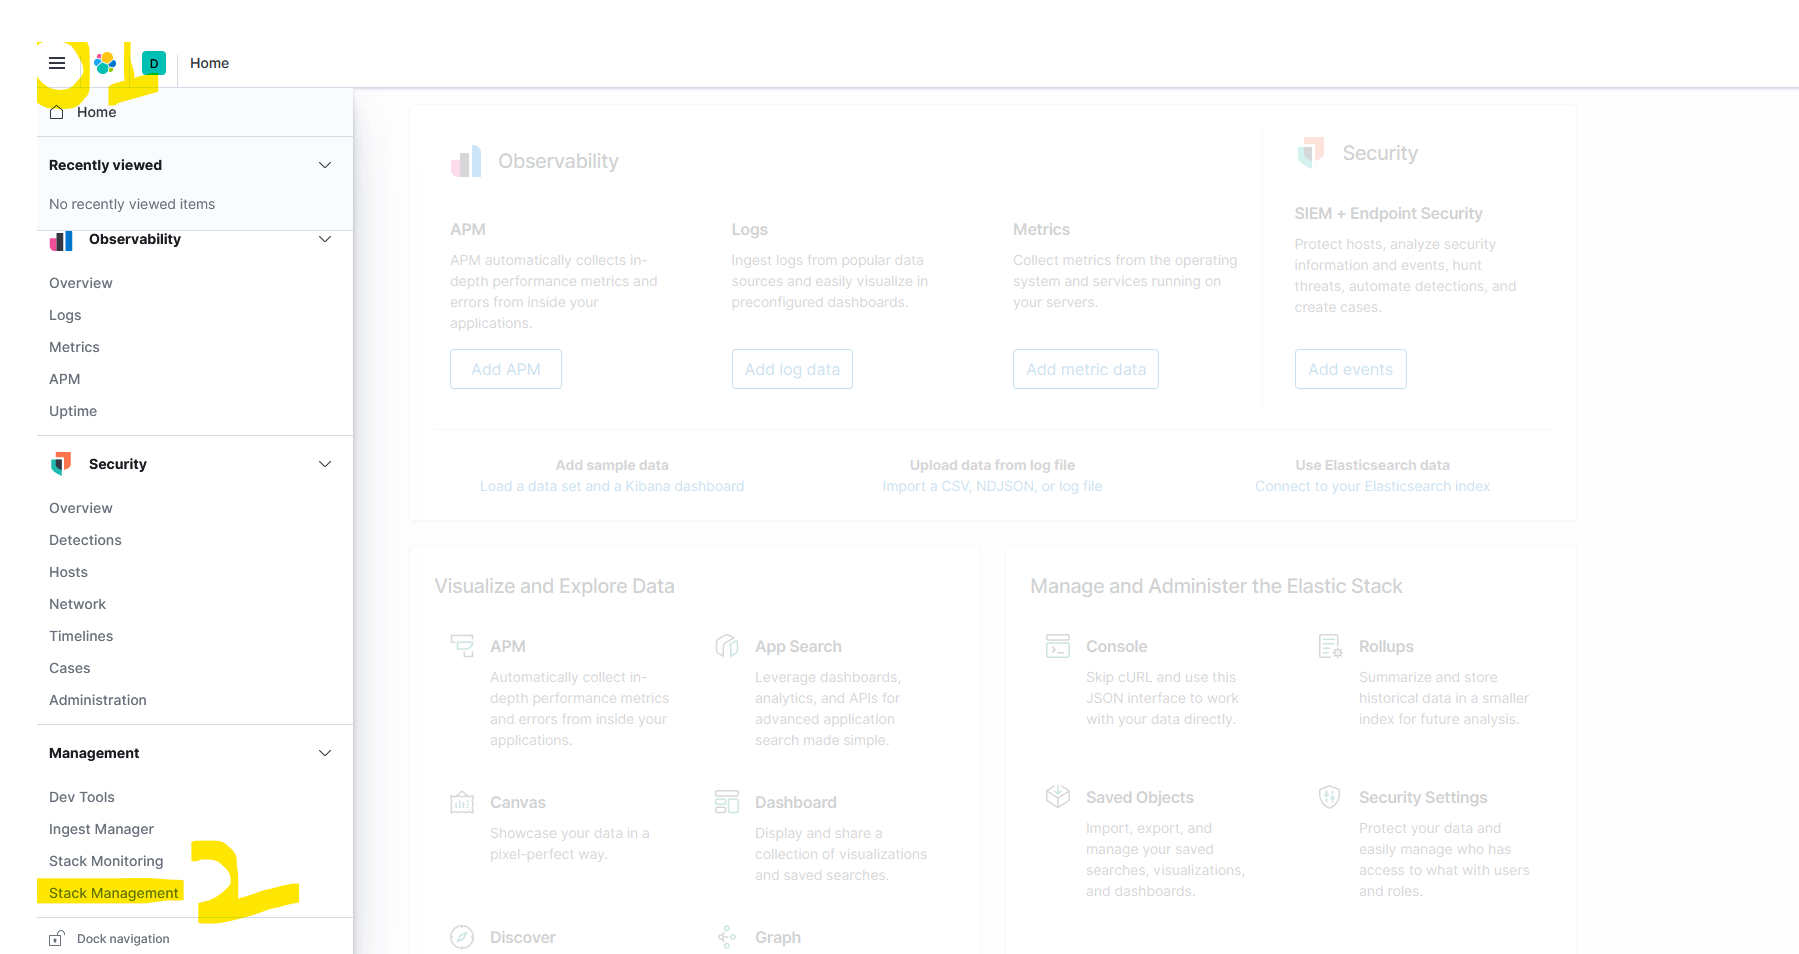
Now click three line (01) option present on extreme left of the dashboard and Go with the stack management .
Click on highlighted area to create the Logstash index, as give below in the screenshot.
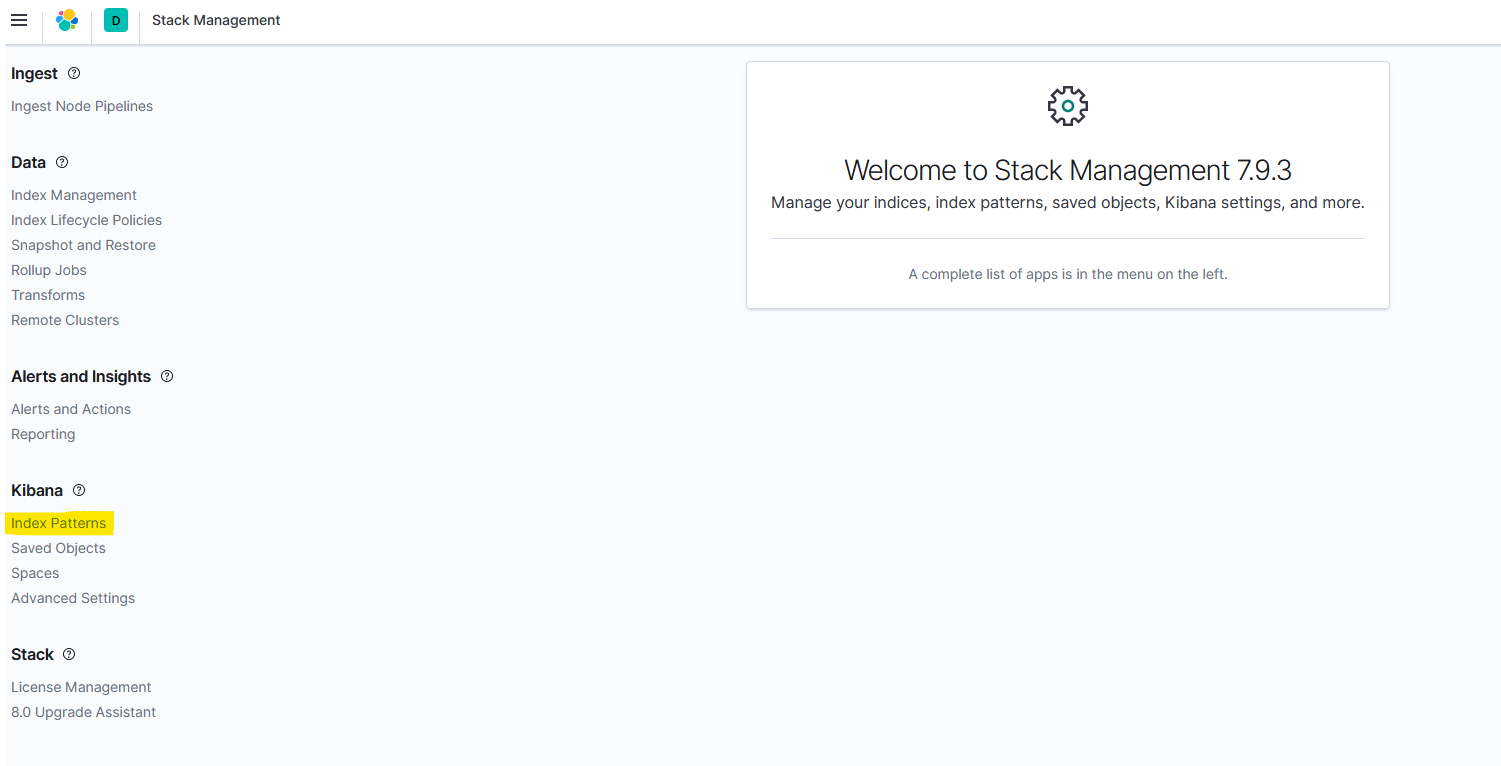
Click on Create pattern index and give the index name as Logstash*, check-in on timestamp and Proceed.
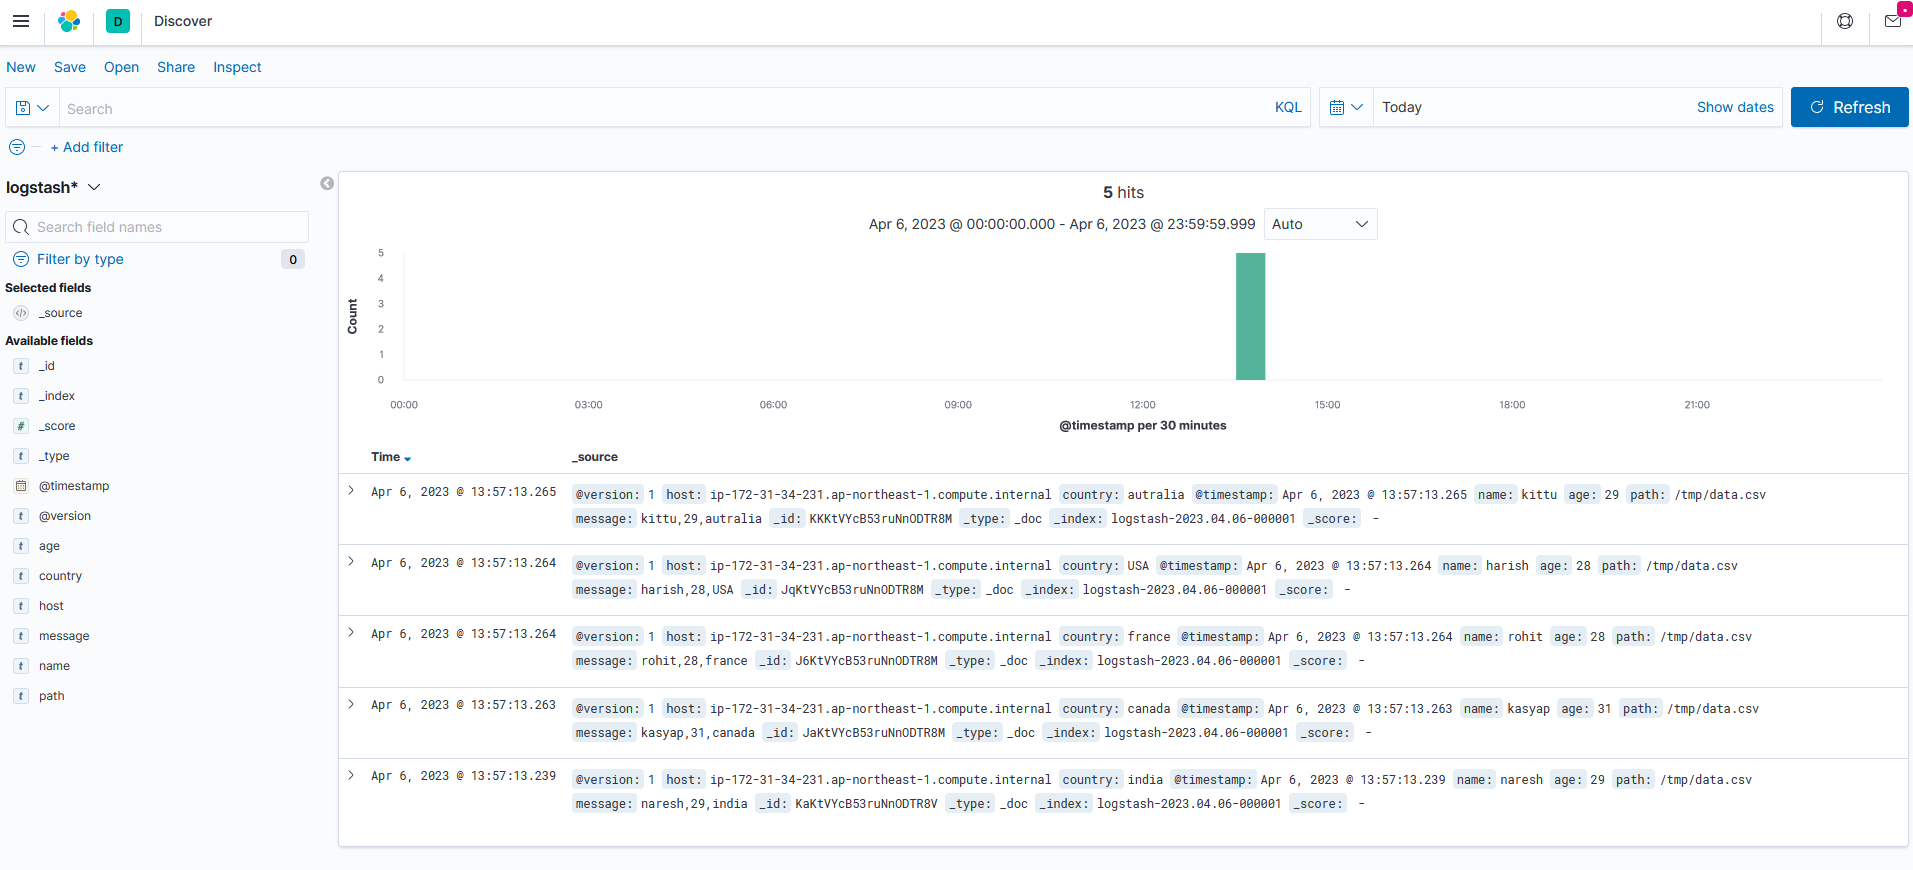
Finally, we can see the logs of the CSV file using Logstash.
Note:
If you see any error while starting the Logstash or are not able to open the Kibana after Logstash installation or configuring.
please go with the log's # tail -f /var/log/logstash/logstash-plain.log
All the ELasticstack tools must be of the same version installed, I used all the tools with 7.9.3 versions.


